Area guide
Summerside homes for sale
2 homes are on the market in Summerside right now — live from the MLS® feed. Prices range from $89k to $169k, with a median of $129k.
Homes for sale
2
Median price
$129k
Price range
$89k – $169k
Avg days on market
49 days
Typical build year
1981
Average size
1,114 sqft
Summerside at a glance
Four live metrics, each against its Newfoundland & Labrador reference — the notch on the ring marks the reference value.
Days on market
NL average 159 days
↓ faster than NL
With seller's direction
0 of 2 listings
no deadlines found
Median vs NL
NL median $238k
↓ below NL median
Share of NL listings
2 of 3337 listings
share of the provincial market
Notch on the ring = the Newfoundland & Labrador reference value for that metric.
Air quality now
Low risk
Elevation
29 m
Air quality and elevation are sampled at the city centroid. Offer deadlines are extracted automatically from listing remarks and may be incomplete or wrong — confirm terms with the listing brokerage.
What $129k buys in Summerside
Drag your budget — how many homes fit, and their typical size.
Homes at this budget
2of 2
100% of Summerside listings
Typical size at this budget
Studio–1 bd
most common bedroom count
Where Summerside listings are priced
The shape of the market right now — every active list price, with the median marked.
View as table
| Price band | Homes | Share |
|---|---|---|
| $89k–$102k | 1 | 50% |
| $102k–$116k | 0 | 0% |
| $116k–$129k | 0 | 0% |
| $129k–$142k | 0 | 0% |
| $142k–$156k | 0 | 0% |
| $156k–$169k | 1 | 50% |
Where Summerside listings are
Every active listing plotted at its coordinates, with the city centroid and the approximate extent of what's on the market.
2 listings plotted · extent = convex hull of listing coordinates, so it moves as inventory does · click a dot to open the listing
Open in search map →Inside Summerside, street by street
Too few active listings in Summerside to break the market down by street yet — this appears once at least 3 homes are on the market.
How Summerside compares
Median list price against the next biggest markets — click a row to visit that guide.
How Summerside heats, by era
Active listings by heating fuel and the decade they were built — click any cell to search it.
View as table
| Fuel | <50 | 50s | 60s | 70s | 80s | 90s | 00s | 10s | 20s | ? |
|---|---|---|---|---|---|---|---|---|---|---|
| Electric | · | · | · | 1 | 1 | · | · | · | · | · |
The year in Summerside
Average daily high temperature, month by month — the shape of the seasons you'd be buying into.
View as table
| Month | Mean daily max (°C) |
|---|---|
| Jan | -2.7 |
| Feb | -3.0 |
| Mar | 0.8 |
| Apr | 6.4 |
| May | 12.4 |
| Jun | 17.4 |
| Jul | 21.9 |
| Aug | 21.6 |
| Sep | 17.1 |
| Oct | 10.8 |
| Nov | 5.0 |
| Dec | 0.4 |
On the market
Latest listings in Summerside
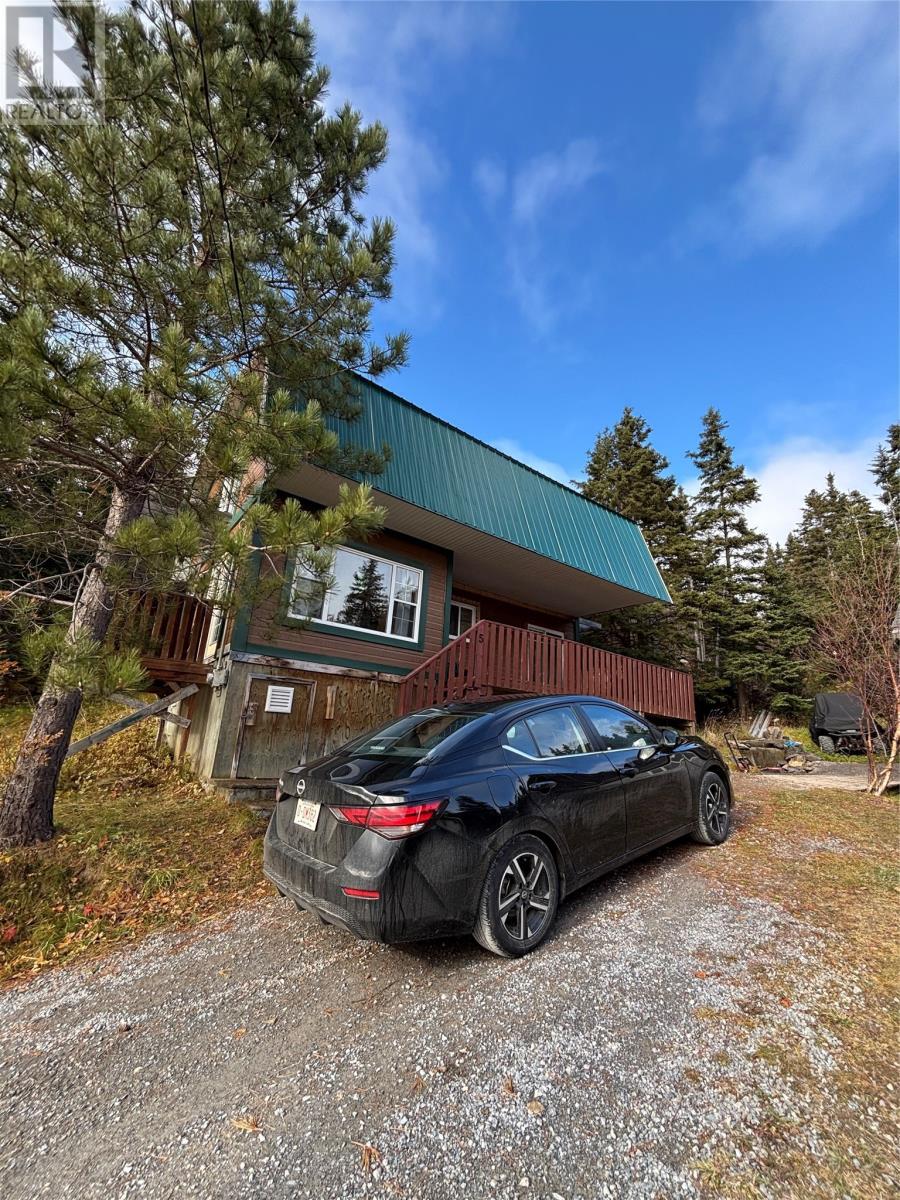
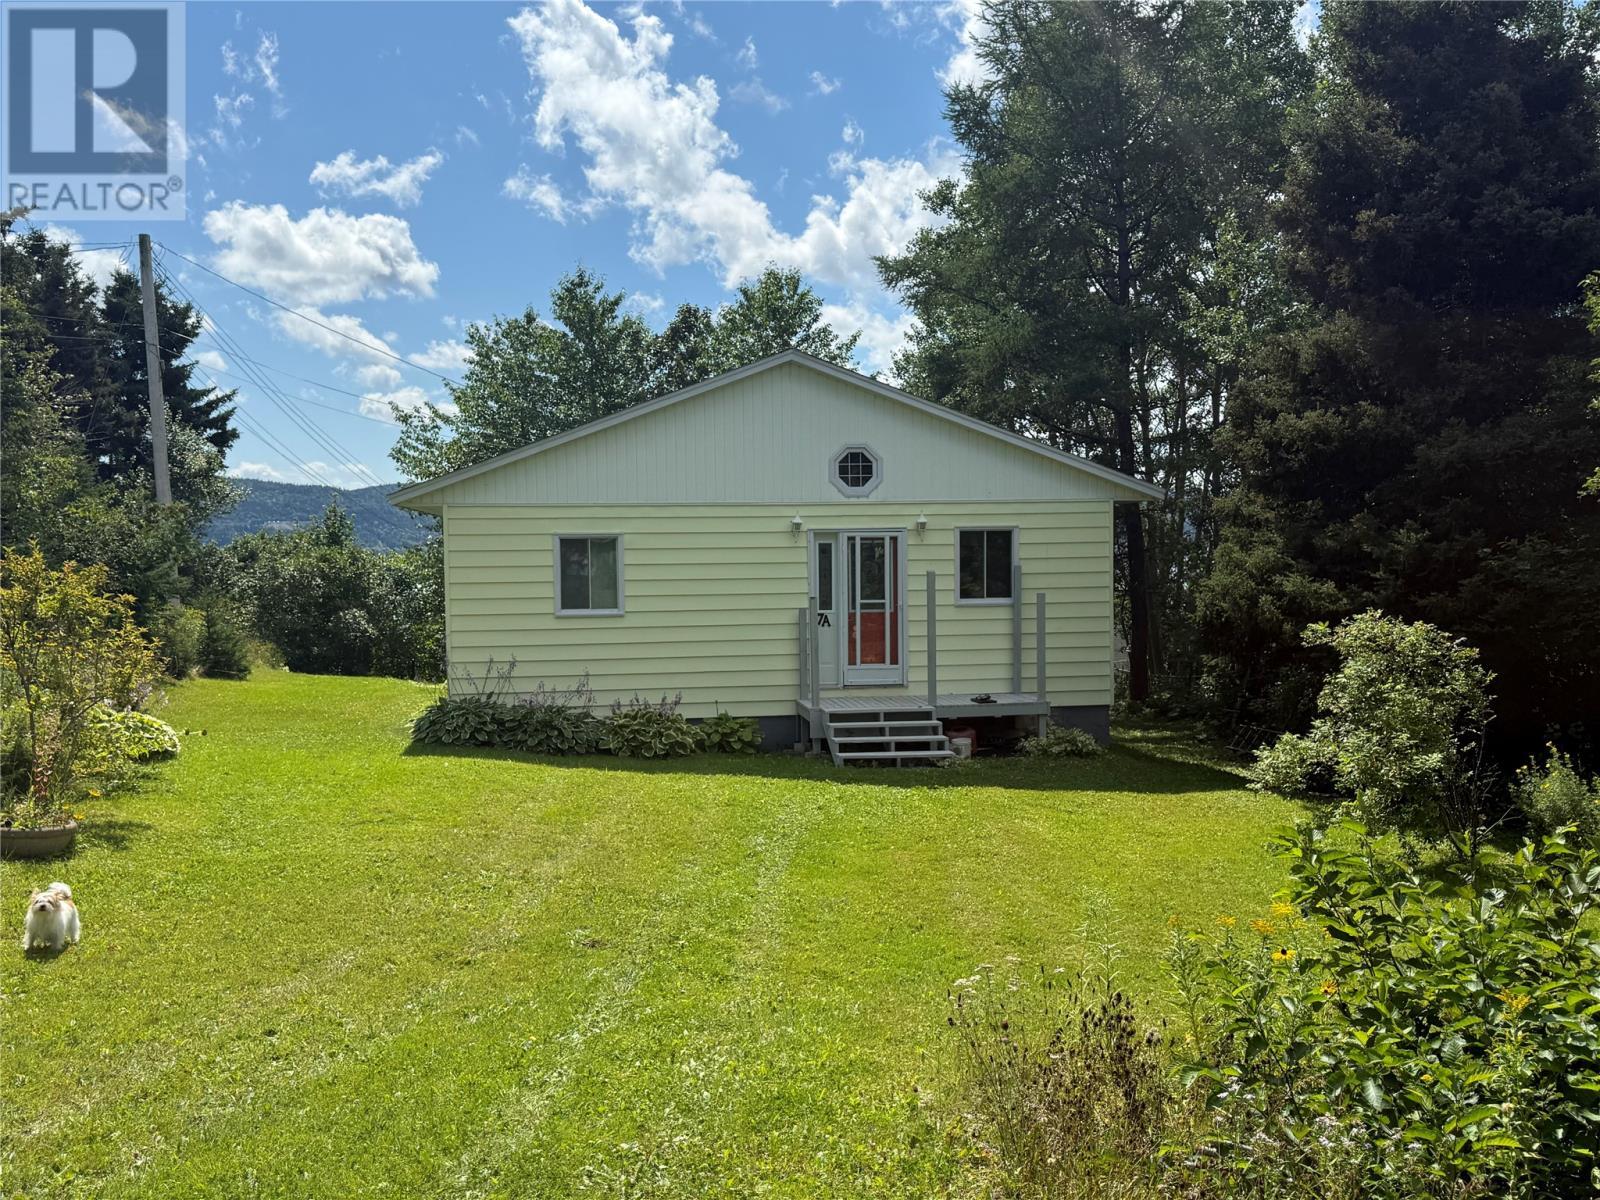
Thinking about buying or selling in Summerside?
Haris works this market every day. Get a straight answer on what your home is worth or what to offer on one you love.