Area guide
Pleasantview homes for sale
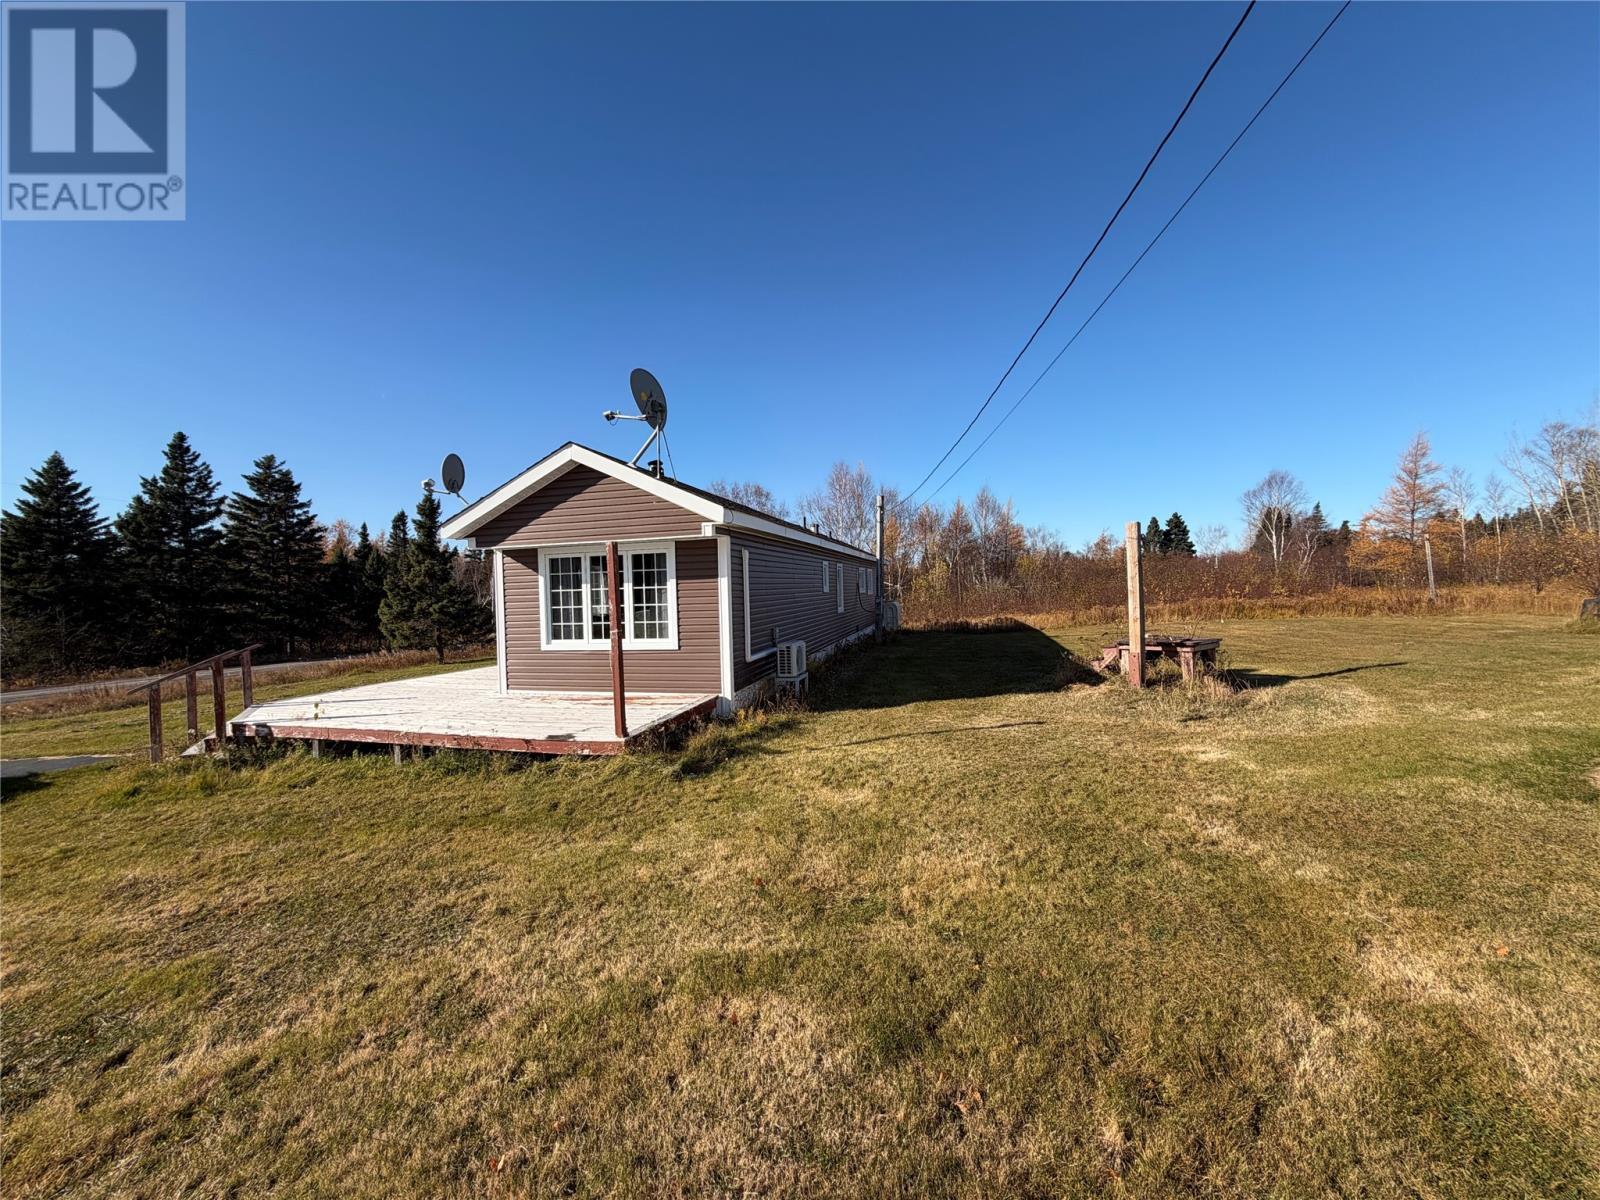
1 home is on the market in Pleasantview right now — live from the MLS® feed. Prices range from $115k to $115k, with a median of $115k.
Homes for sale
1
Median price
$115k
Price range
$115k – $115k
Avg days on market
2 days
Typical build year
1976
Average size
908 sqft
Pleasantview at a glance
Four live metrics, each against its Newfoundland & Labrador reference — the notch on the ring marks the reference value.
Days on market
NL average 157 days
↓ faster than NL
With seller's direction
0 of 1 listings
no deadlines found
Median vs NL
NL median $239k
↓ below NL median
Share of NL listings
1 of 3355 listings
share of the provincial market
Notch on the ring = the Newfoundland & Labrador reference value for that metric.
Air quality now
Low risk
Elevation
17 m
Air quality and elevation are sampled at the city centroid. Offer deadlines are extracted automatically from listing remarks and may be incomplete or wrong — confirm terms with the listing brokerage.
What $115k buys in Pleasantview
Drag your budget — how many homes fit, and their typical size.
Homes at this budget
1of 1
100% of Pleasantview listings
Typical size at this budget
3 bd
most common bedroom count
Where Pleasantview listings are priced
The shape of the market right now — every active list price, with the median marked.
Not enough priced listings in Pleasantview to draw the distribution yet — it appears as soon as more homes hit the market.
Where Pleasantview listings are
Every active listing plotted at its coordinates, with the city centroid and the approximate extent of what's on the market.
1 listing plotted · extent = convex hull of listing coordinates, so it moves as inventory does · click a dot to open the listing
Open in search map →Inside Pleasantview, street by street
Too few active listings in Pleasantview to break the market down by street yet — this appears once at least 3 homes are on the market.
How Pleasantview compares
Median list price against the next biggest markets — click a row to visit that guide.
Pleasantviewnearby markets
How Pleasantview heats, by era
Active listings by heating fuel and the decade they were built — click any cell to search it.
View as table
| Fuel | <50 | 50s | 60s | 70s | 80s | 90s | 00s | 10s | 20s | ? |
|---|---|---|---|---|---|---|---|---|---|---|
| Oil | · | · | · | 1 | · | · | · | · | · | · |
The year in Pleasantview
Average daily high temperature, month by month — the shape of the seasons you'd be buying into.
View as table
| Month | Mean daily max (°C) |
|---|---|
| Jan | -2.5 |
| Feb | -2.5 |
| Mar | 1.1 |
| Apr | 6.3 |
| May | 12.6 |
| Jun | 17.8 |
| Jul | 22.6 |
| Aug | 22.4 |
| Sep | 17.4 |
| Oct | 11.1 |
| Nov | 5.0 |
| Dec | 0.3 |
On the market
Latest listings in Pleasantview
Thinking about buying or selling in Pleasantview?
Haris works this market every day. Get a straight answer on what your home is worth or what to offer on one you love.