For sale · MLS® 1304948
202 Water Street
St. John's, NL, A1C1A9

List price
$699,000
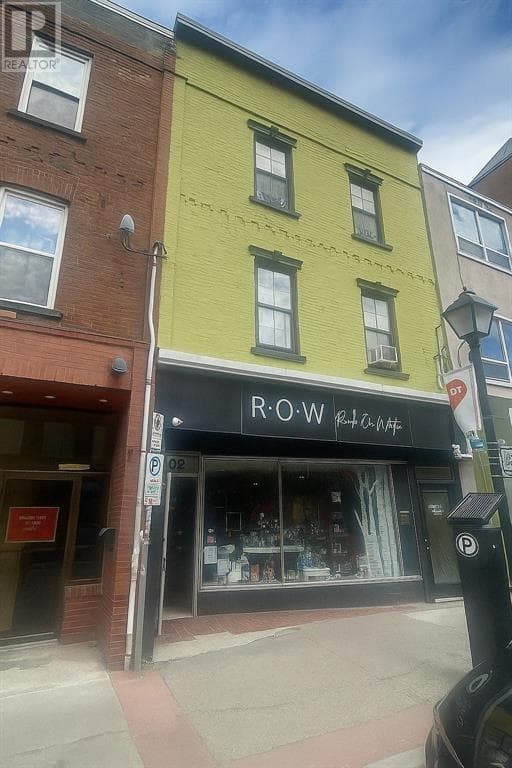

About this propertyMLS® 1304948
Exceptional Investment on Historic Water Street in Downtown St. John’s. This is a rare opportunity to own a fully leased mixed-use property in one of the city’s most desirable locations. Situated at 202 Water Street, the building features two commercial storefronts on the main and second floors, along with a residential apartment on the third floor, offering a strong tenant mix and dependable income. Generating an annual income of approximately $67,000, this property provides both consistent cash flow and long-term value. Located along the designated Pedestrian Mall, it benefits from some of the highest foot traffic during the summer months, making it an ideal spot for retail or service-based businesses. With its classic brick façade, excellent street visibility, and prime downtown setting, this property is perfect for investors looking to expand their portfolio or buyers seeking a signature commercial space in one of St. John’s most vibrant areas. (id:56688)
Specifications
Property details
Overview
The home
Systems & utilities
Size & land
Taxes
Parking & outdoor
Features
Fees & source
Room by room
Rooms
The neighbourhood
St. John's at a glance
Live market stats for St. John's — what's for sale, what it costs, how it compares to nearby towns, and how walkable this address is.
Homes for sale here
449
Median list price
$400k
Price range
$1.4k – $4.3M
Typical build
1976
Average size
3,670 sqft
Where St. John's listings are priced
Every active list price in St. John's, grouped into bands.
List price, thousands of $ · 379 homes
View as table
| Price band ($) | Listings |
|---|---|
| <200 | 39 |
| 200–300 | 53 |
| 300–400 | 101 |
| 400–500 | 57 |
| 500–750 | 62 |
| 750–1M | 32 |
| 1M+ | 35 |
How St. John's compares
Median list price against the next biggest markets — click a row for that area guide.


The essentials
Location, air, flood & taxes
Flood (100-yr)
outside the mapped floodplain
Zoning
0.27 ha parcel
Elevation
10 m
0300 mmetres above sea level
Air quality now
1–3 band
110+AQHI 2 · Low risk · St. John's · updated 10:00 p.m.
Property tax
$4,770 / year
≈ $398 / month
Climate
Feb -1° · Jul 21°
normal daily high · ST JOHN'S A station · 1981–2010
Amenity constellation
compass view · OpenStreetMap · ODEF schools
Nearby & drive routes
98 places shown · 3 routes · OpenStreetMap · OSRM
- 2 min to downtown St. John's1.2 km
- 8 min to Memorial University4.3 km
- 13 min to Avalon Mall9.9 km
Schools 22
Health 1
Groceries 9
Cafés 11
Parks 26
Bus stops 29
Cost & context
What this home really costs
Winter heat, five years of ownership, how this price sits against the market, and what the map says is within walking distance — every figure captioned with its assumptions.
5-year cost of ownership
20% down · 25-yr
5-year all-in: $227,226
Closing costs + five years of running costs + 60 mortgage payments on a $699,000 home.
If rates rise 2 points
$39,937 more over five years if the rate is 6.44% instead of 4.44% — P&I only.
Once, at closing
- Land transfer (registration) fee$100 + $0.40 per $100 over $500, capped at $5,000$2,894
- Legal feesest.estimate — your lawyer quotes the exact figure$1,500
- Down payment (20%)$139,800
Every year
- Heatingest.2× the Jan–Mar estimate (heating season ≈ 6 months)$1,626
- Property taxfrom the feed$4,770
- Home insuranceest.estimate — NL range $700–$1,500/yr$1,100
× 5 years = $37,480
By down payment
| Down | Payment | 5-yr all-in | Note |
|---|---|---|---|
| 5% | $3,668 | $261,980 | needs mortgage insurance (not modelled) |
| 10% | $3,475 | $250,395 | needs mortgage insurance (not modelled) |
| 20% | $3,089 | $227,226 | no mortgage insurance |
Estimates — not a quote or an appraisal. Mortgage at 4.44% (best market 5-yr fixed, Ratehub.ca, 2026-11-02), 25-year amortization, P&I only. Land transfer fee: Registry of Deeds schedule ($100 + $0.40/$100 over $500, cap $5,000). Legal $1,500 and insurance $1,100/yr (NL range $700–$1,500) are estimates. Heating is 2× the Jan–Mar winter estimate. 5-year all-in = closing costs + 5 years of running costs + 60 mortgage payments; it excludes CMHC insurance (needed below 20% down), utilities other than heat, and maintenance.
Rate time machine
same house · same down payment
Same house, same down payment — your payment today at 4.44%best market rate · posted was 6.19%
- Today, best market rate2026-11-02 · 4.44%$3,089/mo
- Today, posted2026-10-28 · 6.19%$3,668/mo
- 5 years ago2021-11-03 · 4.79%$3,201/mo
- 10 years ago2016-11-02 · 4.64%$3,153/mo
At 6.19% — five years ago — the same mortgage would have cost $579 more each month than at today's posted rate.
Principal & interest only: $559,200 (80% of the $699,000 asking price — 20% down), 25-year amortization. No taxes, insurance, fees, or mortgage insurance. Today's rate is the Bank of Canada conventional 5-year rate observed 2026-10-28. The 5- and 10-year rows are two documented observations of that same series (2021-11-03 = 4.79%, 2016-11-02 = 4.64%, retrieved 2026-11-01 from bankofcanada.ca/valet) — fixed reference points, not a modelled path between them. Estimate — not an offer of credit; your lender's rate will differ.
Errand score
walk-time weighted
56
grocery 350 m, school 210 m
Nearest errand: Water Street at Courthouse (bus stop) — 40 m, about 1 min on foot.
Walk-time-weighted from OpenStreetMap + ODEF school data; straight-line distance at 4.8 km/h. Weights: grocery 1.0, school 0.9, health 0.8, park 0.4, café 0.35, bus 0.3 — nearest place per category only. Half-value every 6 minutes of walking; nothing scores past a 15-minute walk. 100 = every category at the door. This is a mapping of what's drawn on the map, not a survey of what exists.
Ask this listing
open data · 5 questions
- School within 1 km?Yes · 210 mAnna Templeton Centre
- Grocery nearby?Yes · 350 mSo Kee Grocery
- Bus stop?Yes · 40 mWater Street at Courthouse
- In the 100-year floodplain?No — outside itCity of St. John's flood map
- Zoning?CDM — CDM0.27 ha parcel
From OpenStreetMap + ODEF schools (straight-line distance) and the City of St. John's flood & zoning maps. Flood and zoning are mapped for St. John's only; elsewhere those questions don't appear because we don't know the answer.
Monthly carrying cost
$3,211/mo
Plan ahead
Calculators
Estimate payments and returns before you make an offer — all in one place.
Plan ahead
Mortgage & investment calculator
Estimated monthly payment
$398/mo
Principal & interest $0 + property tax $398 per month
Financing breakdown
Rental math
Investment calculator
Monthly cash flow
$-397
NOI / month
$-397
Cap rate
-0.68%
Gross yield
0.00%
| Line item | Monthly | Yearly |
|---|---|---|
| Gross rent | $0 | $0 |
| Mortgage | $0 | $0 |
| Property tax | $398 | $4,770 |
| Expenses | $0 | $0 |
| Vacancy | $0 | $0 |
| Management | $0 | $0 |
| Cash flow | $-397 | $-4,764 |
| NOI | $-397 | $-4,764 |
Flip rule of thumb: buy at ≤ 70% of ARV minus repair costs.
Get in touch
Have a question?
Send a message and Haris will get back to you — usually the same day.

Talk to Haris
A real person, every time
Buying, selling, or just curious about what your home is worth — no call centres, no runaround.
- Call or text416-873-4676
- Emailharis@barki.co
- Office17 Duffy Place, Suite 200, St. John's
Keller Williams Platinum Realty
Your details go straight to Haris — never shared, never spammed.