36-38 Pearson Street
St. John's, NL, A1A3R1

List price
$1,399,900
About this propertyMLS® 1293019
Same owner for 50 years, first time offered! Exceptional commercial property, located at the corner of Pearson Street and Torbay Road, offers a unique and highly desirable investment opportunity. Multi-tenant building caters to seven diverse tenants, many of whom have chosen to stay for decades, testament to the stability and appeal of the space. The 7500 sqft building is located on a spacious 20,713 square foot lot, the site provides ample parking and visibility, good foot traffic ensures tenant satisfaction. Survey dated September 19, 2025. Roof resurfaced in 2016. Some new plumbing and electrical. Financial details available. Don't miss your chance to own a piece of prime real estate with a legacy of success and community presence.
Property details
More details
Overview
The home
Systems & utilities
Size & land
Taxes
Features
Fees & source
Rooms
St. John's at a glance
Live market stats for St. John's: what's for sale, what it costs, how it compares to nearby towns, and how walkable this address is.
Homes for sale here
426
Median list price
$405k
Price range
$65k – $4.3M
Typical build
1976
Average size
3,745 sqft
Where St. John's listings are priced
Every active list price in St. John's, grouped into bands.
List price, thousands of $ · 354 homes
View as table
| Price band ($) | Listings |
|---|---|
| <200 | 39 |
| 200–300 | 55 |
| 300–400 | 81 |
| 400–500 | 48 |
| 500–750 | 65 |
| 750–1M | 30 |
| 1M+ | 36 |
How St. John's compares
Median list price against the next biggest markets. Click a row for that area guide.
Neighbourhood scores
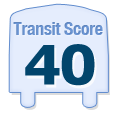
Walk, bike, and transit scores for this exact address.


Location, air, flood & taxes
Flood (100-yr)
outside the mapped floodplain
Zoning
0.22 ha parcel
Elevation
68 m
0300 mmetres above sea level
Air quality now
1–3 band
110+AQHI 2 · Low risk · St. John's · updated 6:30 p.m.
Property tax
$27,986 / year
≈ $2,332 / month · assessment year 2025
Climate
Feb -1° · Jul 21°
normal daily high · ST JOHN'S A station · 1981–2010
Amenity constellation
compass view · OpenStreetMap · ODEF schools
Nearby & drive routes
81 places shown · OpenStreetMap · OSRM
Schools 26
Health 4
Groceries 10
Cafés 5
Parks 17
Bus stops 19
What this home really costs
Winter heat, five years of ownership, how this price sits against the market, and what the map says is within walking distance: every figure captioned with its assumptions.
5-year cost of ownership
20% down · 25-yr
5-year all-in: $558,028
Closing costs + five years of running costs + 60 mortgage payments on a $1,399,900 home.
If rates rise 2 points
$81,507 more over five years if the rate is 6.84% instead of 4.84% (P&I only).
Once, at closing
- Land transfer (registration) fee$100 + $0.40 per $100 over $500, capped at $5,000$5,000
- Legal feesest.estimate, your lawyer quotes the exact figure$1,500
- Down payment (20%)$279,980
Every year
- Heatingest.2× the Jan–Mar estimate (heating season ≈ 6 months)$3,904
- Property taxfrom the feed$27,986
- Home insuranceest.estimate, NL range $700–$1,500/yr$1,100
× 5 years = $164,950
By down payment
| Down | Payment | 5-yr all-in | Note |
|---|---|---|---|
| 5% | $7,651 | $630,511 | needs mortgage insurance (not modelled) |
| 10% | $7,248 | $606,350 | needs mortgage insurance (not modelled) |
| 20% | $6,443 | $558,028 | no mortgage insurance |
Estimates, not a quote or an appraisal. Mortgage at 4.84% (lowest bank 5-yr fixed, Ratehub.ca, 2026-11-20), 25-year amortization, P&I only. Land transfer fee: Registry of Deeds schedule ($100 + $0.40/$100 over $500, cap $5,000). Legal $1,500 and insurance $1,100/yr (NL range $700–$1,500) are estimates. Heating is 2× the Jan–Mar winter estimate. 5-year all-in = closing costs + 5 years of running costs + 60 mortgage payments; it excludes CMHC insurance (needed below 20% down), utilities other than heat, and maintenance.
Price ghosts
$/sqft vs 299 active
Priced at the 44th percentile of active St. John's homes
$187/sqft, city median $198/sqft.
Winter warmer
Jan–Mar · estimate
$651/mo
Est. winter heating (heat pump electricity): about $1,952 for January through March.
Estimate, not an appraisal. heat pump electricity at 15.587¢/kWh (Newfoundland Power, eff. Jul 1 2026, pre-HST). 7,500 sqft. Severity 1.00× St. John's from the ST JOHN'S A station 1981–2010 normal. Jan–Mar only; excludes HST, hot water, cooking and any cooling.
More cost & context panels
Rate time machine
same house · same down payment
Same house, same down payment: your payment today at 4.84%lowest bank rate · posted was 6.19%
- Today, lowest bank rate2026-11-20 · 4.84%$6,443/mo
- Today, posted2026-11-18 · 6.19%$7,346/mo
- 5 years ago2021-11-03 · 4.79%$6,411/mo
- 10 years ago2016-11-02 · 4.64%$6,314/mo
At 6.19%, five years ago, the same mortgage would have cost $903 more each month than at today's posted rate.
Principal & interest only: $1,119,920 (80% of the $1,399,900 asking price, 20% down), 25-year amortization. No taxes, insurance, fees, or mortgage insurance. Today's rate is the Bank of Canada conventional 5-year rate observed 2026-11-18. The 5- and 10-year rows are two documented observations of that same series (2021-11-03 = 4.79%, 2016-11-02 = 4.64%, retrieved 2026-11-01 from bankofcanada.ca/valet), fixed reference points, not a modelled path between them. Estimate, not an offer of credit; your lender's rate will differ.
Errand score
walk-time weighted
66
grocery 100 m, school 420 m
Nearest errand: Circle K (grocery), 100 m, about 1 min on foot.
Walk-time-weighted from OpenStreetMap + ODEF school data; straight-line distance at 4.8 km/h. Weights: grocery 1.0, school 0.9, health 0.8, park 0.4, café 0.35, bus 0.3; nearest place per category only. Half-value every 6 minutes of walking; nothing scores past a 15-minute walk. 100 = every category at the door. This is a mapping of what's drawn on the map, not a survey of what exists.
Ask this listing
open data · 5 questions
- School within 1 km?Yes · 420 mMacdonald Drive Junior High
- Grocery nearby?Yes · 100 mCircle K
- Bus stop?Yes · 210 mTorbay Road at Torbay Road Apartments
- In the 100-year floodplain?No, outside itCity of St. John's flood map
- Zoning?CN: Commercial Neighbourhood0.22 ha parcel
From OpenStreetMap + ODEF schools (straight-line distance) and the City of St. John's flood & zoning maps. Flood and zoning are mapped for St. John's only; elsewhere those questions don't appear because we don't know the answer.
Monthly carrying cost
$8,235/mo
Calculators
Estimate payments and returns before you make an offer, all in one place.
Mortgage & investment calculator
Estimated monthly payment
$2,333/mo
Principal & interest $0 + property tax $2,333 per month
Financing breakdown
Investment calculator
Monthly cash flow
$-2,332
NOI / month
$-2,332
Cap rate
-2.00%
Gross yield
0.00%
| Line item | Monthly | Yearly |
|---|---|---|
| Gross rent | $0 | $0 |
| Mortgage | $0 | $0 |
| Property tax | $2,333 | $27,986 |
| Expenses | $0 | $0 |
| Vacancy | $0 | $0 |
| Management | $0 | $0 |
| Cash flow | $-2,332 | $-27,984 |
| NOI | $-2,332 | $-27,984 |
Flip rule of thumb: buy at ≤ 70% of ARV minus repair costs.
Have a question?
Send a message and Haris will get back to you — usually the same day.

Talk to Haris
Buying, selling, or just curious about what your home is worth — no call centres, no runaround.
- Call or text416-873-4676
- Emailharis@barki.co
- Office17 Duffy Place, Suite 200, St. John's
Keller Williams Platinum Realty